
Sailing the Pacific Cup: Isobars to the Tiki Bars
Loren Brindze, starting with SoCal’s Begg Rock Race, helps Pacific Cup navigators understand the weather gods and gurus to interpret the plethora of data being downloaded from the global array of devices designed to help racers navigate the ocean weather chaos ahead of the umbrella drinks in Hawaii.
“You aren’t going to see any of that,” I typed into the group chat.
The race officer for the Pacific Singlehanded Sailing Association had done his homework ahead of the upcoming Begg Rock Race. The race, an almost 200-miler, was one of my favorites in Southern California’s Dan Byrne Series.
The officer had pulled forecasts from NOAA, ECMWF, even PredictWind. Eight models in rare agreement: moderate breeze, mostly reaching, seas one to three meters. He posted the forecast with the kind of confidence you rarely see with any offshore weather report. He had every reason to be confident. If all the forecasts agree, things are probably pretty stable and you can trust any one of them. If they don’t agree, none can be trusted.
I was looking at this while participating in the race’s group chat when I pulled up the 500-mb chart. Not the surface chart, but a chart much higher up in the middle of the atmosphere. What I saw there made me put the phone down, think for a moment, and then type:
“In fact, you are going to get Santa Anas.”
The Santa Ana winds in Southern California, for those fortunate enough to be unfamiliar with them, are infamous. Warm, dry and relentlessly cruel. This local downslope wind can lead to unpleasant conditions at best and downright dangerous ones at worst. Santa Anas typically occur when high pressure settles over the Great Basin, forcing an intense offshore wind of warm, dry air, often exceeding 40 knots. But they can occasionally occur with a low-pressure system sitting offshore. Where exactly that low settled would have a big impact on the upcoming Begg Rock race.
I reminded myself that most of what drives the weather at the surface is happening far above it. I recently enrolled as a graduate student in the local university’s atmospheric science department, despite being older than some of my professors, let alone the other students. Maybe it was all going to my head a little.
Something wasn’t lining up with the surface GRIBs. These charts showed the consensus the race officer had described: multiple forecast models in agreement, nothing dramatic. But on the upper-level charts, the picture was a little different. Something was brewing just over the horizon. Seven or eight days out, forecast skill (a measure of how good a forecast is at, well, forecasting) is moderate at best, and the surface models can have some of these atmospheric features in the wrong place or at the wrong time. But what I was looking at here in the 500-mb chart left little room for doubt.
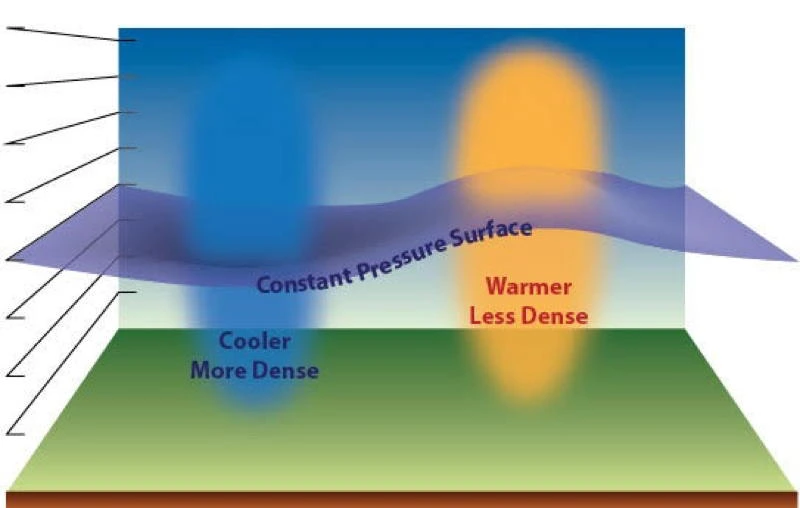
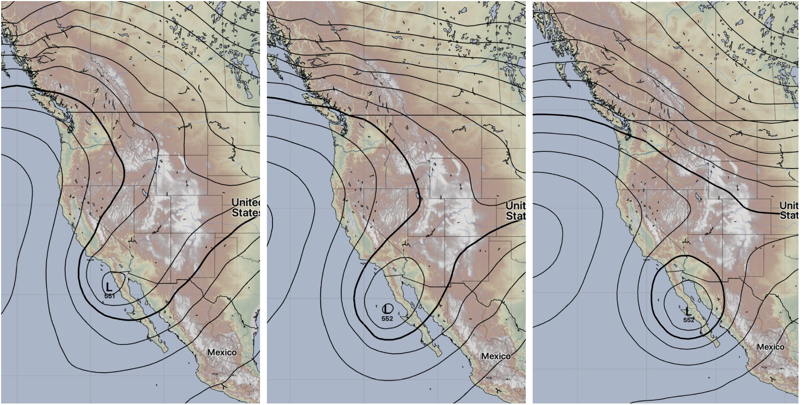
A few hundred miles southwest of the race course, the jet stream, the powerful concentration of westerly wind in the upper troposphere, was doing something recognizable. There was a trough digging southward, steeper on its western wall than its eastern one. It’s the signature of a developing mid-latitude system still deepening, still extending its reach south. I stepped through the forecast 12 hours at a time. The trough kept moving farther south until it pinched off entirely from the jet stream and sat there, spinning on its own. A cutoff low. The kind that parks itself offshore like a junkyard dog waiting for anything to come by and lash out at. Not moving much, and beneath it, a low-pressure center that was already beginning to form.
This was a great example of how the 500-mb chart can be a secret weapon to those in the know. The 500-mb chart is not a surface forecast. It shows the inner trusses and girders of the atmosphere’s mysterious dynamics. In fact, it is exactly half of the air mass in the sky, even though it is “only” 19,000 feet (5600 meters) up. It steers the synoptic-scale surface weather. In this case I could make out the cutoff low already forming two to three days into the forecast, where the forecast skill is much greater than at days seven or eight.

While the exact position wouldn’t be fully resolved for a few more days, I could already surmise that the forming cutoff indicated a decent chance it would be positioned in such a way to negatively affect the race. This was significant because now there was a large enough pressure difference to drive the Santa Anas. Where the low ended up exactly would determine how much of the upcoming race would be a close reach vs. close-hauled.
My secret tool wasn’t reserved only for offshore or coastal romps out to the Channel Islands. It worked just as well for inshore venues such as San Francisco. A cutoff low like this, a few hundred miles north, could bring storms and rain to the Bay Area. Checking to see the positioning of the jet stream’s wiggles, and whether any short waves (smaller disturbances) are propagating along it, could tell you a lot about a place like the S.F. Bay. Just as the trough was associated with air moving vertically upward, leading to more instability at the surface, the ridge has the opposite effect: squashing the air down and increasing the surface pressure. This can bring warm temperatures inland, triggering those strong westerlies that dominate the local meteorology, or cap the fog so it is thick and low, typical in the summertime.
The surface charts showed nothing alarming yet — the setup was still playing out two to three levels above where anyone was looking. But the 500-mb chart doesn’t lie about these things. The cutoff was forming, the pressure differential was building, and whatever the eight models agreed on at the surface, the atmosphere aloft had already made its own plans. A week later, the course was shortened. Warm, dry winds out of the northeast, right on schedule.
For those of you reading who have grand plans on sailing to Hawaii in this year’s Pac Cup, the same chart that told me what eight models had missed off the California coast is the one you should have open before you leave San Francisco. The classic features of this route are clearing the coastline out of San Francisco, crossing the ridge, and screaming dead downwind for the second half while you shed layers, heading south toward the tropical drinks and sandy beaches.
But have you stopped to think what “crossing the ridge” actually means here? Looking at mean sea level pressure alone gives you a rough guess at where the high is sitting. The 500-mb chart shows you the actual structure of the ridge. Identifying that upside-down U tells you how close you can cut the corner before transitioning into your DDW run all the way to Hawaii. Cutoff lows like the one that shortened the Begg Rock course can occur on this route too, and while less dangerous than their Atlantic cousins, they still offer a clear tactical advantage to boats that can identify them early and navigate them correctly.
Most boats won’t finish within the window of reliable surface forecast skill. The upper levels give you a look farther ahead. No, the upper-level forecast is not a silver bullet. It won’t replace your routing software. But it will tell you things your routing software might not see. In this case, I could spot the cutoff forming two to three days into the forecast when the surface models were still showing pleasant reaching. On a 2100-mile race, that kind of early read can be the difference between finding the trades and hunting for them.
By identifying key upper-level features early — cutoff lows, Omega blocks, Rex blocks — you can make better-informed routing decisions before the surface models have resolved them. It is a strange thing: In the age of AI, routing software and broadband GRIBs, a chart you can still access over shortwave radiofax is still one of the sharper tools in the navigator’s chart locker.
I know this because, for the Begg Rock Race, I could see the whole thing playing out days before it arrived. Eight models had agreed on the surface forecast. The atmosphere aloft had already made other plans.
Next June, somewhere between the ridge and the trades, you will have a choice about which one to believe. I noodled about a bit with some more of the forecast details, sighed, and looked up at the Begg Rock trophy won last year on the shelf above me. “I guess I will be giving you away soon,” I thought. “Whoever gets you next is going to have to work really hard to earn it.” Even with this year’s shortened course, they were going to be in for some interesting weather.
Loren Brindze is an amateur offshore singlehanded sailor and professional weather nerd, calculating the risk of specific weather events for Sensible Weather’s consumer weather-insurance product. Previously, he has had the pleasure of working on meteorological products for companies such as Saildrone and Tomorrow.io. He has completed both the Bermuda 1-2 (2021) and Singlehanded Transpacific Race (2025), as well as many seasons of the PSSA’s Dan Byrne Series.
The first Pacific Cup boats start on Monday, July 6.
Good article Loren, and Thank You for it!
Awesome! Always good to see someone going beyond the surface charts.